
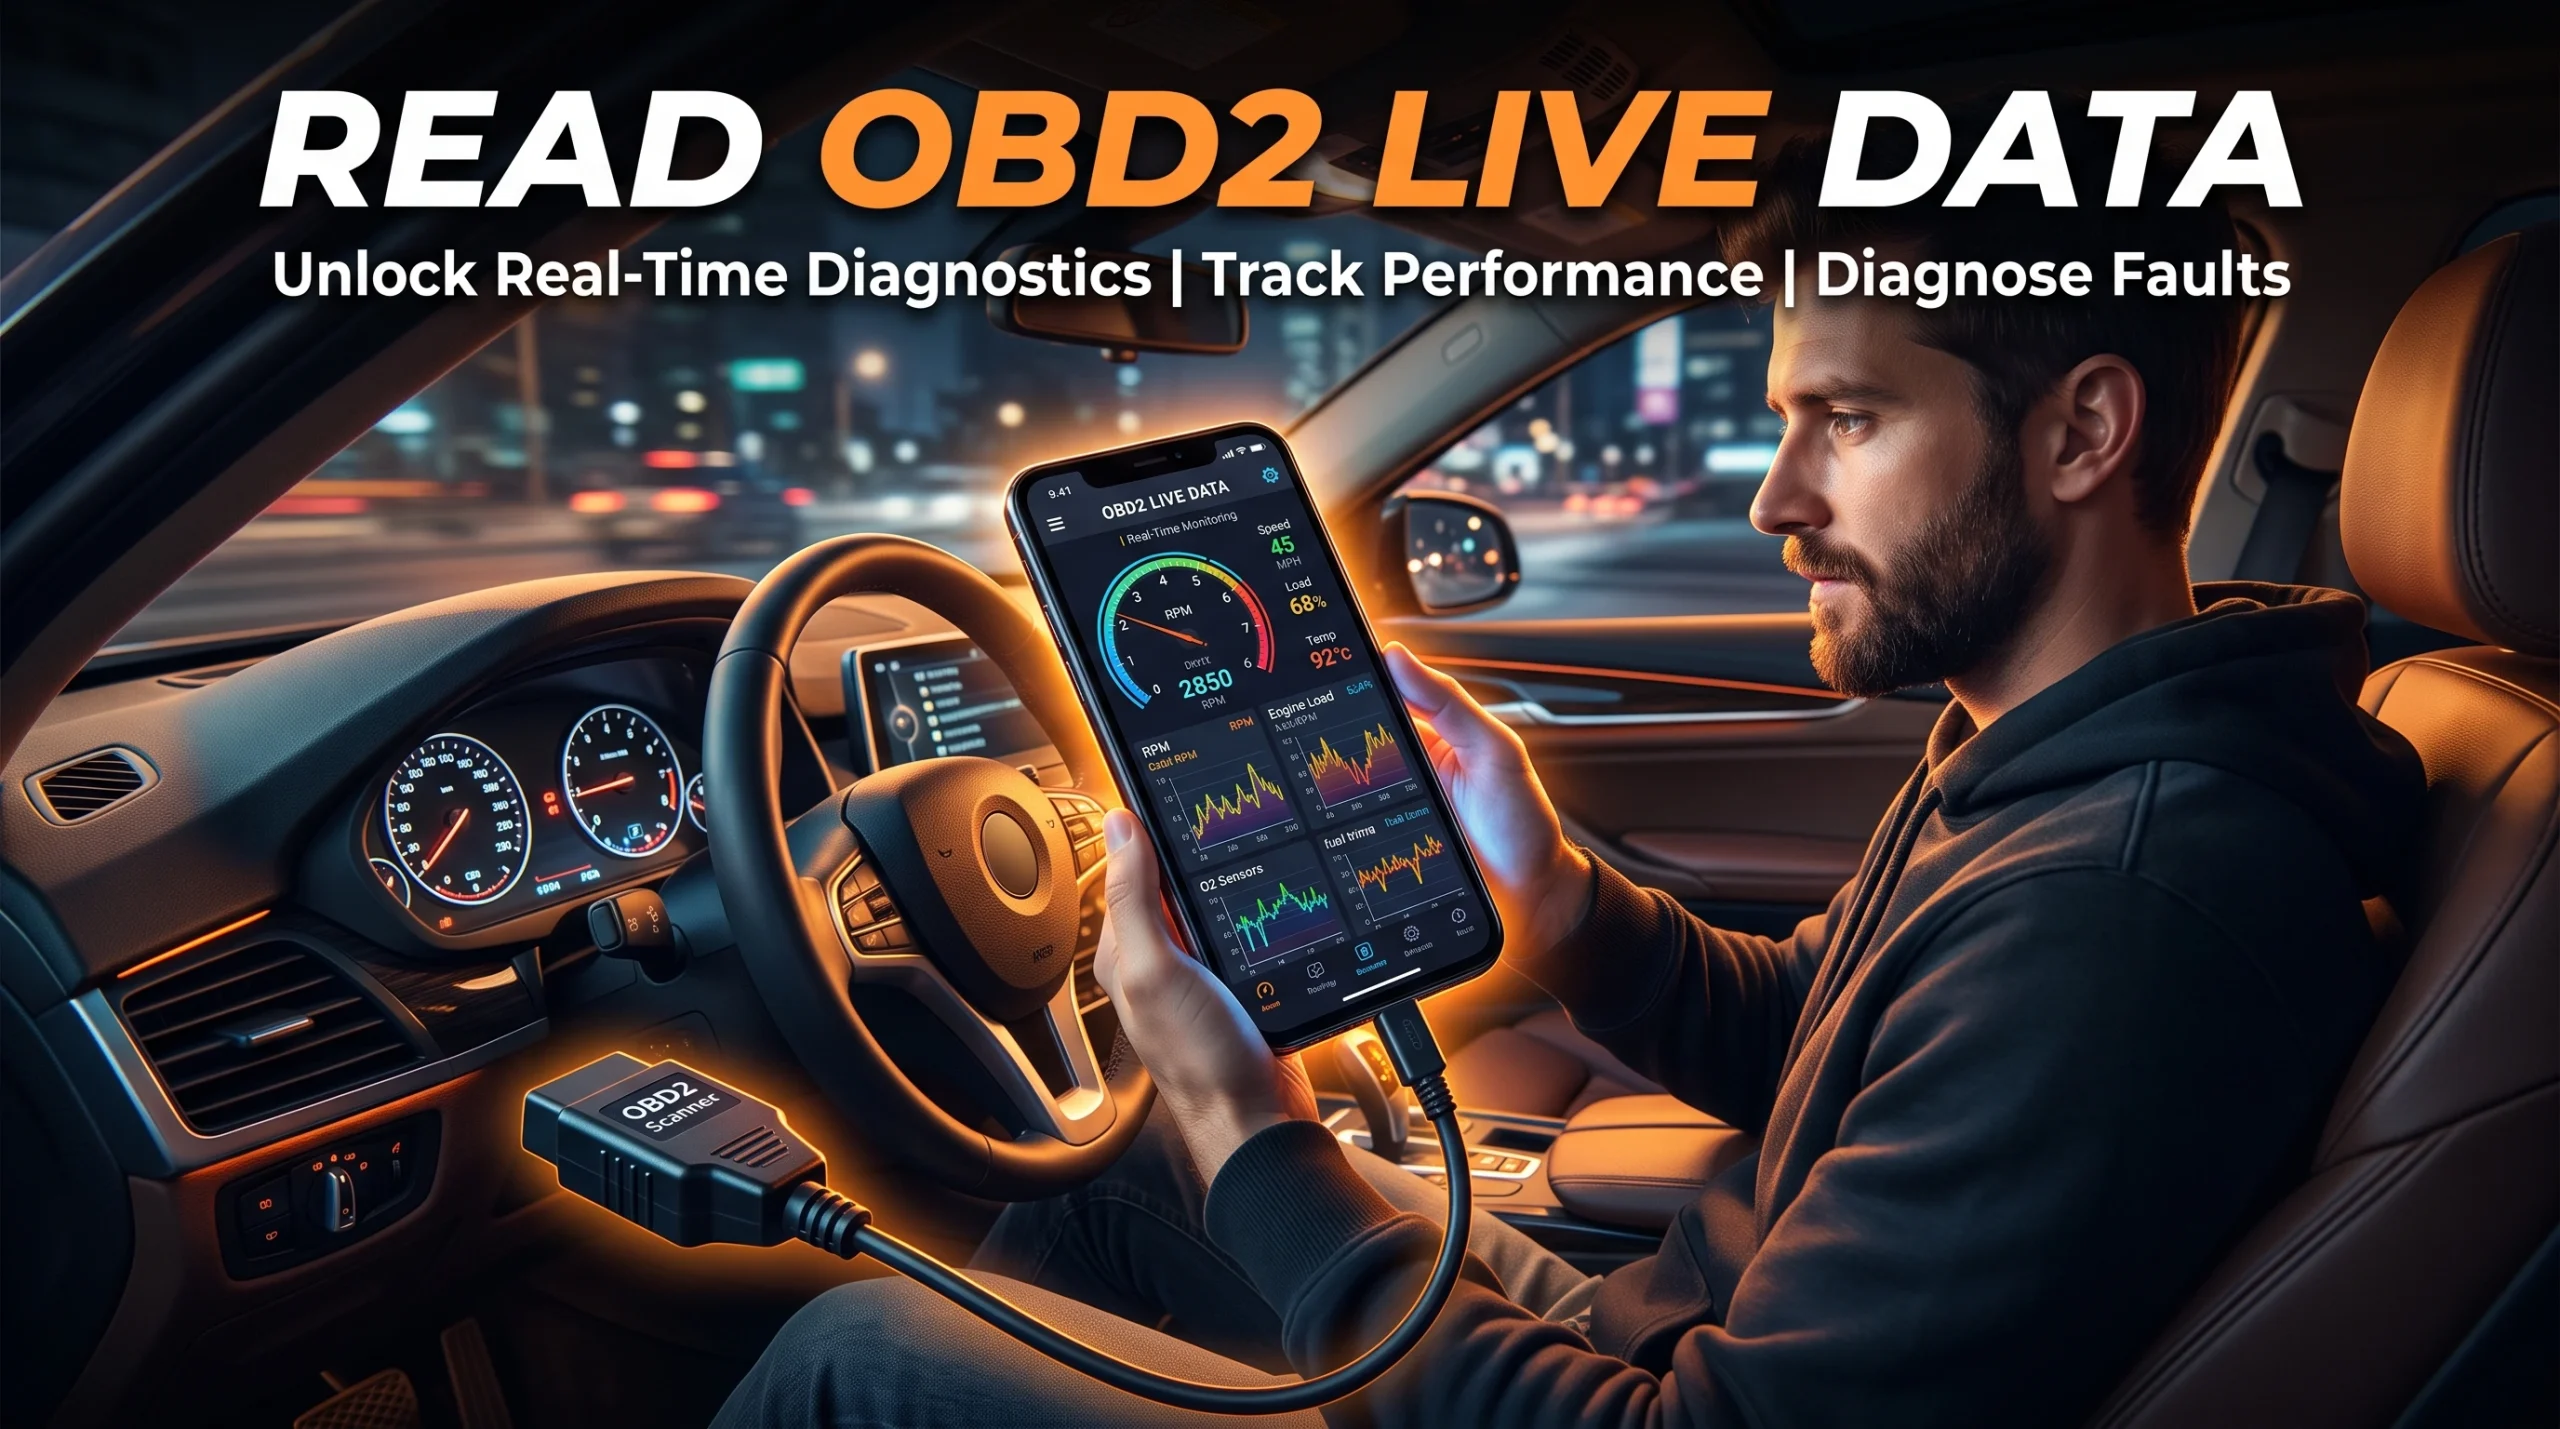
Live data is the stream of sensor values your car is publishing right now, and most scanners will happily show you fifty of them at once, which is why most people look at the screen once and never open it again. The fix is not learning all fifty. It is selecting a handful, graphing them together, and knowing what each one is there to tell you. This page covers the selection, not the diagnosis.
What live data is, and why it is different from a code
A fault code is a conclusion the car already reached. Live data is the raw material underneath it: engine speed, air flow, coolant temperature, oxygen sensor output, throttle position and dozens more, each published as a numbered parameter, usually shortened to PID.
The practical difference matters. A code appears only after the car's own monitor decided something was out of range for long enough to be worth recording. Live data is available all the time, including when nothing has been flagged, which is what makes it useful for intermittent complaints and for confirming that a repair actually changed something. If you have not yet plugged the tool in at all, start with the first plug-in walkthrough and come back to this screen afterward.
Set the scanner up so the screen is readable
Before the values mean anything, make the display usable:
- Deselect everything, then add back only what you want. Most tools default to showing every supported PID. A screen of four to six values is readable; a screen of fifty is not.
- Use the graphing view if your tool has one. Numbers flickering in a table hide the thing you are looking for, which is almost always a change over time rather than an absolute value.
- Note the refresh rate. A tool polling slowly can miss a brief event entirely. Fewer selected PIDs usually means a faster update on each one.
- Record if you can. Watching a screen while driving is unsafe and often impossible alone. Recording a session and reviewing it parked is both safer and more useful.
Phone-based tools and handhelds differ noticeably here, and the trade-offs are covered in Bluetooth dongle or handheld scanner.
The ten values worth watching, and what each one is for
This is a shortlist by usefulness, not a ranking of importance. What counts as a normal reading for any of them is vehicle-specific, so compare what you see against your own vehicle's service data rather than against a number from the internet.
- Engine RPM. The reference clock for everything else. Almost no other value is interpretable without knowing what the engine was doing at the time.
- Vehicle speed. Separates idle behavior from load behavior, and lets you tell a stationary event from a driving one when reviewing a recording.
- Engine coolant temperature. Tells you whether the engine had actually warmed up. A great deal of behavior looks abnormal simply because the engine was still cold.
- Calculated engine load. How hard the engine is working as a proportion of what it could do. It is the value that makes a reading at a traffic light comparable to one on a motorway slip road.
- Short-term fuel trim. The correction the engine is applying to fuelling right now, moment to moment.
- Long-term fuel trim. The learned correction it has settled on over time. Watched with short-term trim, the pair shows whether a correction is momentary or has become the engine's new normal.
- Intake air temperature. Air density changes fuelling, and this is one of the values that explains why the same car behaves differently on a cold night and a hot afternoon.
- Mass air flow or manifold absolute pressure, depending on what your car uses. This is the measurement of how much air is actually entering, which underpins most fuelling behavior.
- Oxygen sensor or air-fuel ratio sensor output. What the exhaust says about the result. Upstream and downstream sensors answer different questions and should not be read as one number.
- Throttle position. Confirms what the driver asked for, which is the only way to tell a car doing something odd from a car doing exactly what the pedal told it.
Reading them together instead of one at a time
Single values in isolation are where people go wrong. Live data becomes readable when you watch two or three that should move together and check whether they do.
Load against RPM tells you the operating condition. Short-term against long-term fuel trim tells you whether a correction is transient or learned. Coolant temperature against elapsed time tells you whether you are looking at warm-up behavior or steady state. Throttle position against speed and RPM tells you whether the car is responding to the driver or to something else.
The other habit worth building is comparing a reading against itself under different conditions rather than against an internet number: the same car, idle versus cruise, cold versus warm. Your own vehicle at a known-good moment is a better baseline than any figure published for a different car. If the car already flagged something, the snapshot it saved at that exact moment is usually more informative than anything you can catch afterward, and that is what freeze frame data is for.
Where this stops being a tool question
Reading live data is a tool skill. Deciding what an unusual reading means about your car is not, and this site does not pretend otherwise.
Fuel trims drifting in one direction, a sensor that responds slowly, a value that sits at an implausible constant: each of these has several possible explanations, and separating them takes symptom context, vehicle-specific service data and often a physical inspection that no scanner performs. Some scanners can also command components directly to test them, which is a different capability again and is covered in who actually needs a bi-directional scan tool.
If your question has become "what is wrong with my car" rather than "what is this screen showing me," that is a repair-diagnosis question, and it belongs with a qualified mechanic or with automotive fault-diagnosis resources rather than with a buying and tooling guide. Our sister-site handoff for warning-light and symptom interpretation is autoartificer.com, and we say that in words rather than sending you there with a link because cross-site linking on this network is not something we do casually.
FAQ
What does PID mean on an OBD2 scanner?
PID stands for parameter identifier. It is the numbered address of a single live value, such as engine coolant temperature, that the scanner requests from the car. When a tool lists "supported PIDs," it is listing which values that vehicle will publish.
How many live data values should I display at once?
Four to six is usually the practical limit for a readable screen, and fewer selected values often means each one updates faster. Selecting everything the tool supports produces a screen that is technically complete and functionally unusable.
Can I read live data while driving?
Only safely if someone else is operating the tool, or if your scanner records a session for you to review later while parked. Watching a screen and driving at the same time is not something we would suggest, and a recording is more useful anyway because you can scrub back to the moment that mattered.
Do I need an expensive scanner to see live data?
No. Most tools including inexpensive phone adapters can display standardized live data. What varies is refresh rate, graphing, recording, and access to manufacturer-specific values beyond the standard set.
Is live data the same on every car?
The standardized parameters are common across compliant vehicles, but which ones a given car actually supports varies, and manufacturers publish additional values outside the standard that only tools with specific support can read.
AutoGearZone does not sell scanners and earns no commission from any brand or tool named here. More on how we work on our about page.
1 thought on “How to Read OBD2 Live Data: The 10 PIDs Worth Watching”